Le Fornaci Ipercoop: estimating shops and visitor flows
by Marco Balistreri · · 4-minute read
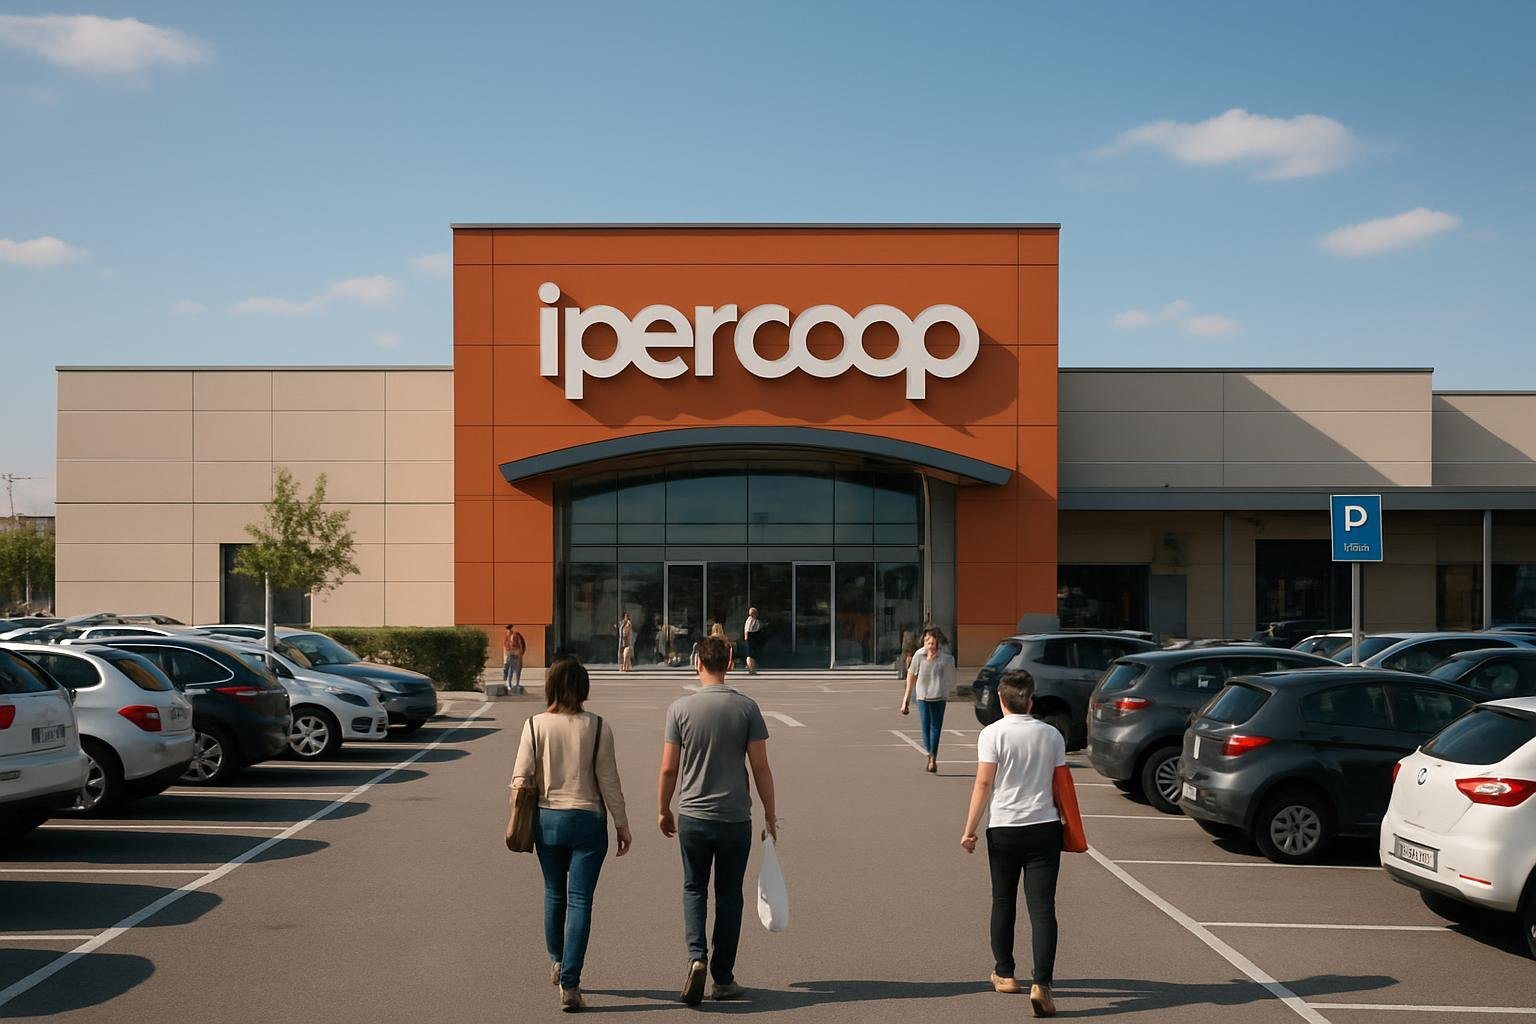
Le Fornaci Ipercoop: how many shops and how much footfall? Introduction
If you are considering an investment, opening a business or simply want to better understand a shopping centre like Le Fornaci Ipercoop, it is useful to estimate two key elements: the composition of shops by category and visitor flows (entries) on a daily, monthly and annual basis. This article provides practical methods, useful indicators and tips for gathering reliable data, with examples applicable to centres in the Turin metropolitan area.
Why understanding the retail structure and visitor flows is important
The distribution of shops by type (food, clothing, services, catering, entertainment, personal care) affects customer behaviour, their length of stay and average turnover per square metre. At the same time, visitor flows determine the visibility and potential profitability of a retail outlet. For buyers, sellers or lessors, these data are essential to assess the performance of a commercial property or the location of a new business.
How to estimate shops by category in a centre like Le Fornaci Ipercoop
Lacking always access to the complete floor plan or official list of businesses, you can proceed as follows:
- Visual surveyVisit the centre and record units occupied by category. Count shop windows and assign a main category (e.g. food, clothing, catering, services, entertainment, personal care).
- Commercial layout analysisIf available (e.g. centre brochure or property website), compare the areas dedicated to Ipercoop and other shopping galleries. The areas indicate capacity to host chains or small shops.
- Typical classificationMany centres with a hypermarket follow a common distribution: 1 large unit (hypermarket), 5–10 food outlets/food court, 15–40 clothing/footwear shops, 5–15 services (banking, hairdressers, insurance), 3–8 units for entertainment and electronics. Use these proportions as a starting point and adjust based on the overall size of the centre.
- Administrative verificationFor official data, you can request information from the Municipality or centre management about commercial land use and permits issued.
Methods to estimate pedestrian traffic: daily, monthly and annual
There are different approaches to estimate flows; here are the most practical and reproducible:
- Direct countingShort counting sessions at main entrances on representative days (a weekday, a Saturday and a Sunday). Multiply the daily average by the number of days in the desired period. This is the most accurate method but time-consuming.
- Parking as proxyIf you know the number of parking spaces and the average daily turnover rate (e.g. 1–3 rotations per day depending on centre type), you can estimate visitor numbers. Example: 1,000 spaces with average turnover 2 → approximately 2,000 visitors per day, considering many cars carry multiple passengers.
- Commercial area and benchmarkThere are industry reports providing visitor indices per 100 m² of GLA (Gross Leasable Area). If you know the total GLA (e.g. hypermarket + gallery), multiply by the appropriate index to get an estimate.
- Sales or turnover dataUsing average expenditure per visitor indicators (estimated by category) you can back-calculate visitor numbers from declared revenues of a store or the hypermarket, if known.
Practical example (combined method)
Suppose you conduct counts on three sample days and obtain an average of 3,500 entries per day. To estimate monthly and annual flows:
- Monthly entries ≈ daily average × days in the month (3,500 × 30 = 105,000)
- Annual entries ≈ daily average × 365 (3,500 × 365 = 1,277,500)
Note: these are illustrative values. During promotional or holiday periods the peaks can double or exceed the average.
Factors influencing visitor flows and shop composition
- Location and accessibilityRoad connections, public transport and parking significantly impact visitor numbers.
- Competition and local offerThe presence of other centres or large stores in the Turin metropolitan area alters demand.
- Commercial planningEvents, seasonal promotions and agreements with attractive brands increase flows.
- Demographic compositionPopulation catchment area and its purchasing power determine the best performing shop types.
How to collect reliable data for Le Fornaci Ipercoop
To obtain robust estimates, follow these steps:
- Perform calculations over multiple days and different times.
- Interview some shopkeepers: they often have customer and sales indicators that can confirm your estimates.
- Check the number of parking spaces and observe their turnover throughout the day.
- Check with the Municipality or owner for any reports or feasibility studies conducted during opening or expansion phases.
Practical advice
- Don't rely on a single day: use a representative average between weekdays, weekends and holidays.
- If you want to evaluate a commercial investment, consider both the flows and the quality of the user base (average income, demographic type).
- Compare the estimates with centres of the same size in the Turin metropolitan area to calibrate your parameters (e.g., Grugliasco, Collegno).
For concrete support in data collection or a personalised assessment of the commercial location in Turin and surroundings, contact us: we can help you interpret the numbers and turn them into operational decisions.
If you are interested in exploring the urban planning and real estate impact in neighbouring areas, also read our article on the real estate market of Grugliasco and on Collegno.
Do you have questions about this topic or your property?
Talk to us